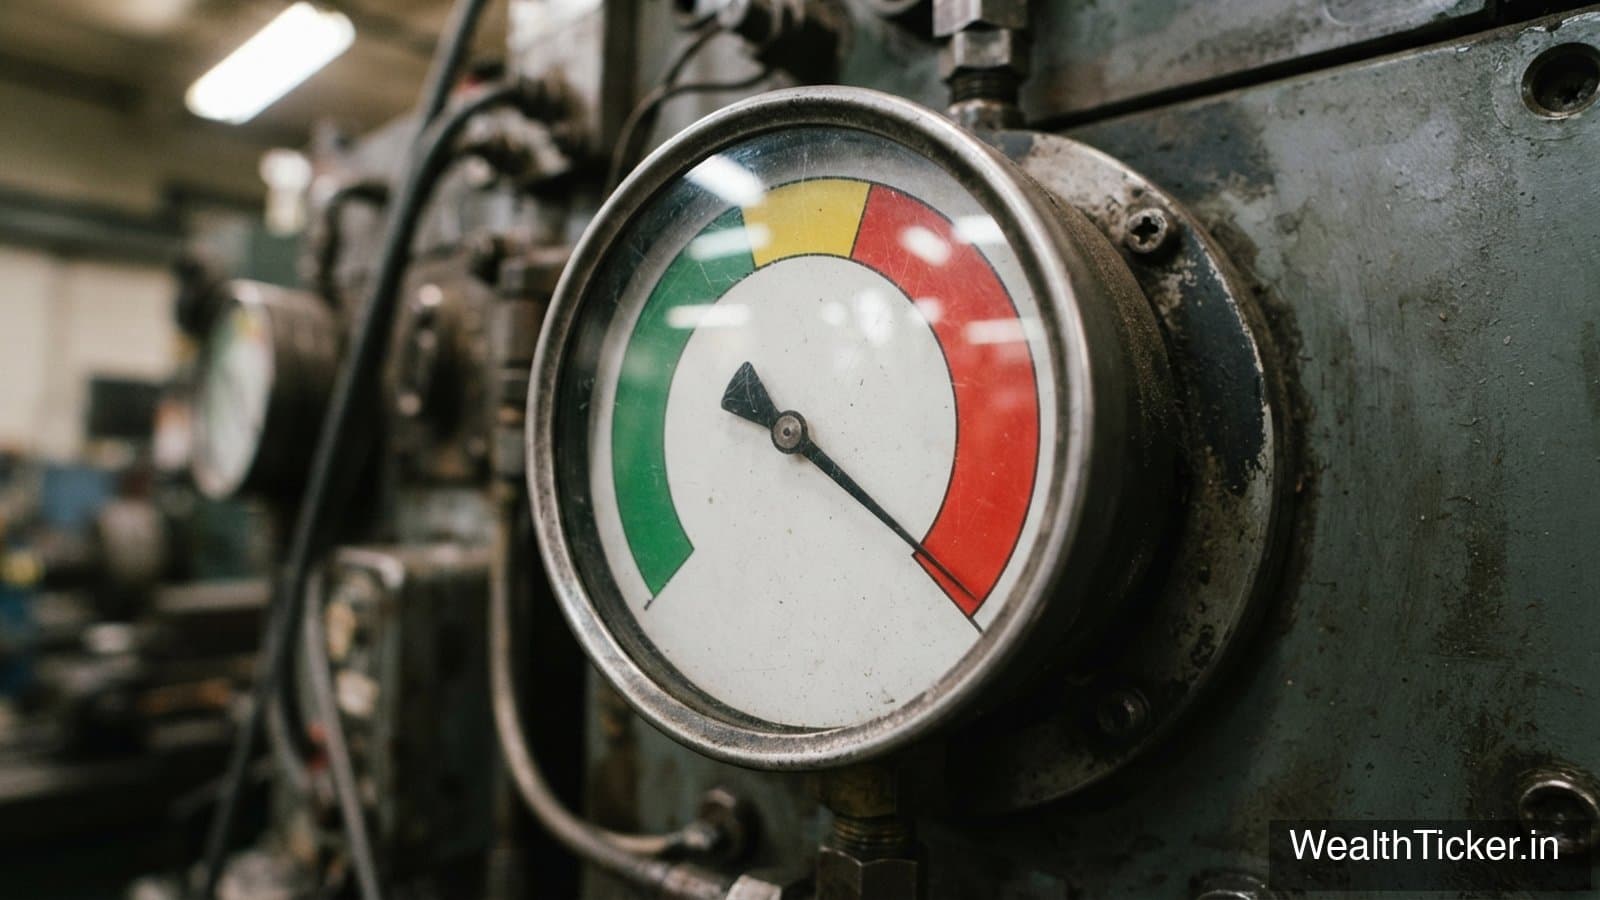
A quiet gauge, a falling index
India VIX is the market's own estimate of how bumpy the next month will be. In the July–September quarter of 2026 it said: not very. It never closed above 14.68 and touched a low of 10.35 on 23 September.
Over the same quarter the Nifty 50 fell 5.2%, from 23,865.75 on 30 June to 22,620.45 on 30 September. From its high of 24,774.30 on 3 August to the 30 September close, the fall was 8.7%.
A falling market with a calm VIX is a different thing from March 2026, when the fall was sharp and the gauge jumped. This post puts the two side by side, from NSE's daily history.
The VIX month by month
| Month | Average close | Lowest | Highest | Days above 20 |
|---|---|---|---|---|
| January | 11.81 | 9.19 | 14.45 | 0 |
| February | 12.91 | 11.55 | 14.36 | 0 |
| March | 22.11 | 17.13 | 27.89 | 13 |
| April | 19.97 | 17.21 | 25.52 | 6 |
| May | 17.76 | 14.98 | 19.63 | 0 |
| June | 14.54 | 12.67 | 17.03 | 0 |
| July | 12.82 | 11.65 | 14.68 | 0 |
| August | 11.48 | 10.57 | 12.25 | 0 |
| September | 11.99 | 10.35 | 13.64 | 0 |
The peak for the year was 27.89 on 30 March. VIX closed above 20 on 19 sessions in March and April combined, and on none since. August's average of 11.48 was the lowest monthly average of the year.
For context, over the ten years from October 2016 the median daily close was 14.81 and the average 16.42. All three months of the quarter averaged below that median.
The Nifty's daily moves
The index had only eight sessions in the quarter with a move of 1% or more, in either direction:
| Date | Nifty 50 close | Day's move |
|---|---|---|
| 8 July | 23,882.05 | −2.12% |
| 10 July | 24,206.90 | +1.02% |
| 17 July | 24,334.30 | +1.09% |
| 29 July | 24,250.20 | +1.10% |
| 3 August | 24,774.30 | +1.60% |
| 15 September | 23,118.60 | −1.19% |
| 24 September | 23,063.10 | −1.64% |
| 28 September | 22,780.25 | −1.56% |
The biggest fall, 2.12% on 8 July, coincides with the quarter's highest VIX close (14.68). The September losses came in three one-day drops, not in a panic: the index ended the month 6.1% lower than August's close with VIX's September high at 13.64.
So a market can lose 5% over a quarter without any single day looking dramatic. In this quarter the largest daily fall was 2.12% and the largest gain 1.60%. Volatility measures the size of the swings, not whether they add up in one direction.
Back near the year's low
The Nifty 50's low for 2026 so far was 22,331.40 on 30 March. Its close on 1 October was 22,421.95, only 0.4% above that. VIX that day rose to 14.46, up from 13.49 the day before but well below March's 27.89.
The year's high was 26,328.55 on 2 January. The index is 14.8% below it. (The 14.2% fall to 1 October shown in our other posts is measured from the 31 December close, 26,129.60.)
How to use this
- VIX is not a forecast of direction. In March it rose with a fall; in Q3 it stayed low through one.
- Calm is not the same as cheap. For where the index's valuation stands, see the Nifty 50 P/E in October 2026.
- Earlier episodes are covered in the March 2026 VIX spike and the calm of August.
- Staying invested through falls is discussed in should you stop your SIP in a market crash.
This is a record of what the gauge showed, not a prediction.
Frequently asked questions
What is India VIX?
India VIX is NSE's volatility index. It shows the market's expectation of how much the Nifty 50 will move over the next 30 days, annualised, as implied by option prices. A higher reading means options are pricier and traders expect larger swings.
Where did India VIX end the third quarter of 2026?
It closed at 13.49 on 30 September 2026, against 13.60 on 30 June. Over the quarter it ranged from 10.35 (23 September) to 14.68 (8 July). On 1 October it rose to 14.46.
Did VIX warn of the Nifty's fall in Q3?
Not in this quarter. The Nifty 50 fell 8.7% from its 3 August high to its 30 September close, and VIX stayed in the low teens throughout. A low VIX describes expected volatility, not direction.
This is commentary on published data, not investment advice. WealthTicker is not a SEBI-registered adviser or distributor. Figures are as of the dates stated and can be revised by their source.
Keep reading
2026 so far: NSE indices that rose and fell most
To 1 October 2026 Nifty India Defence is up 18.0% and Nifty Pharma 15.8%; Nifty IT is down 25.3% and the Nifty 50 14.2%. Leaders, laggards and size.
Factor indices in 2026: momentum leads, value held
To 22 September 2026, Nifty Alpha 50 rose 10.3% and Nifty500 Momentum 50 3.0%, while the Nifty 50 fell 10.7%. Value held up in the fall; low volatility did not.
India VIX back near 11: how fast the fear gauge fell
India VIX closed at 11.32 on 19 August 2026, down 59% from 27.89 on 30 March. Only 6.5% of closes since 2014 have been lower. How it got here.